Overview of SUM and SUMX Function
In Power BI, both SUM and SUMX are DAX functions used for aggregation, but they operate in fundamentally different ways. SUM is a simple aggregation function that directly adds up all the numbers in a single column; it is straightforward and efficient, working best when you need a basic total of existing values in a column. In contrast, SUMX is an iterator function that evaluates an expression for each row in a table before summing the results. This row-by-row operation provides immense flexibility, allowing you to perform complex calculations. While SUMX is more powerful for row-level logic, it can be computationally heavier than the more performant SUM, guiding the choice between them based on whether you need a direct column sum or a calculated row-wise aggregation.
Examples of SUM and SUMX Function
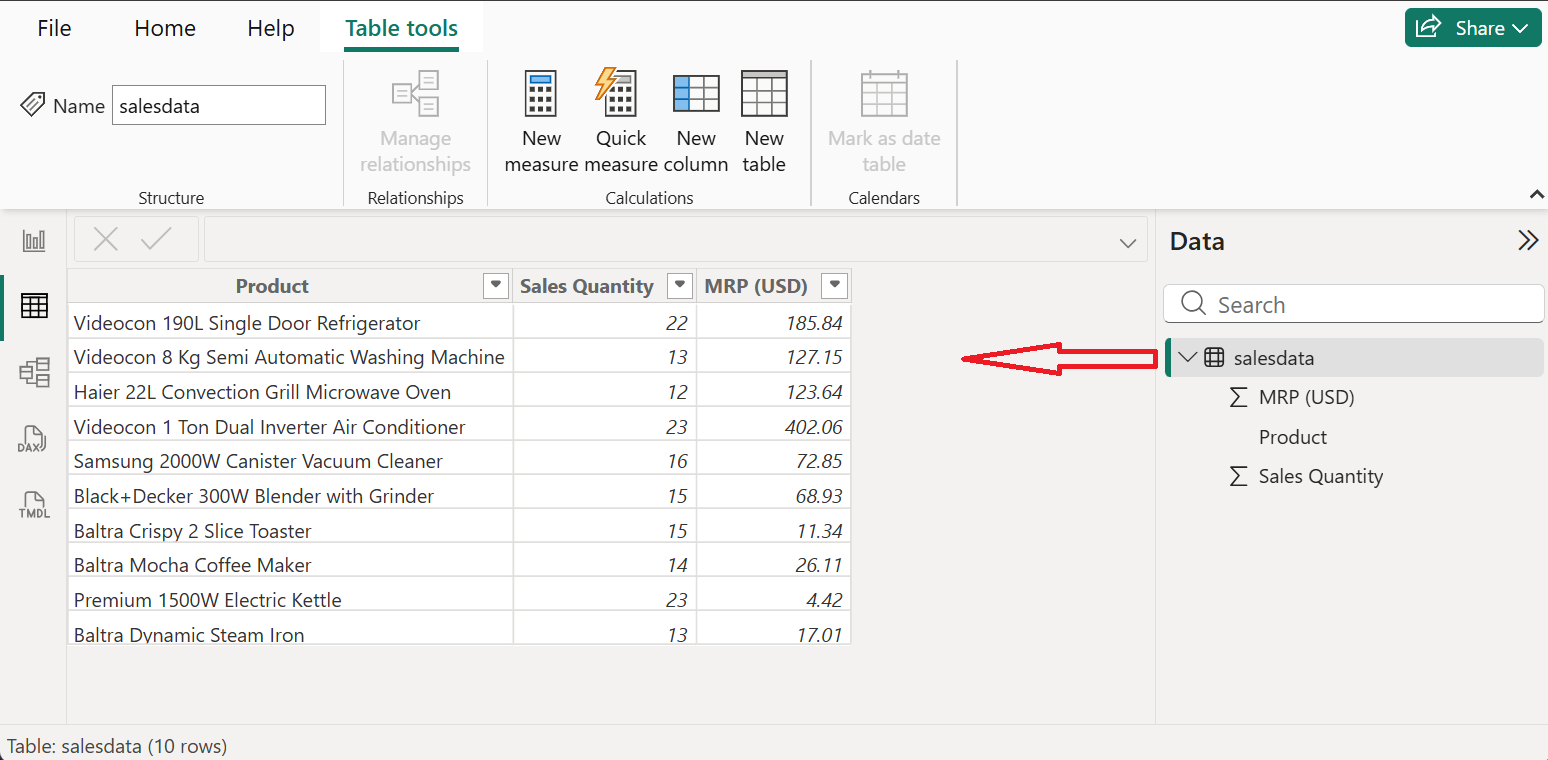
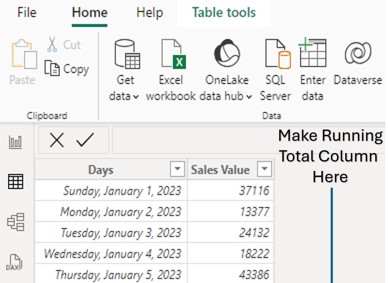
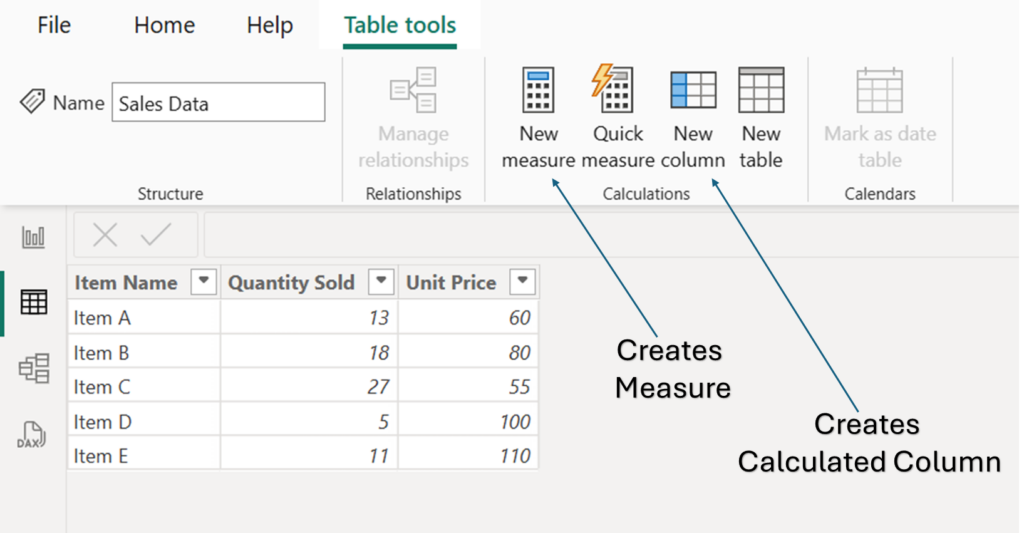
In above table, there is a data of products, sales quantity and Unit Price (USD). Requirement is to visualize total quantity sold and total sales revenue.
Total Quantity Sold
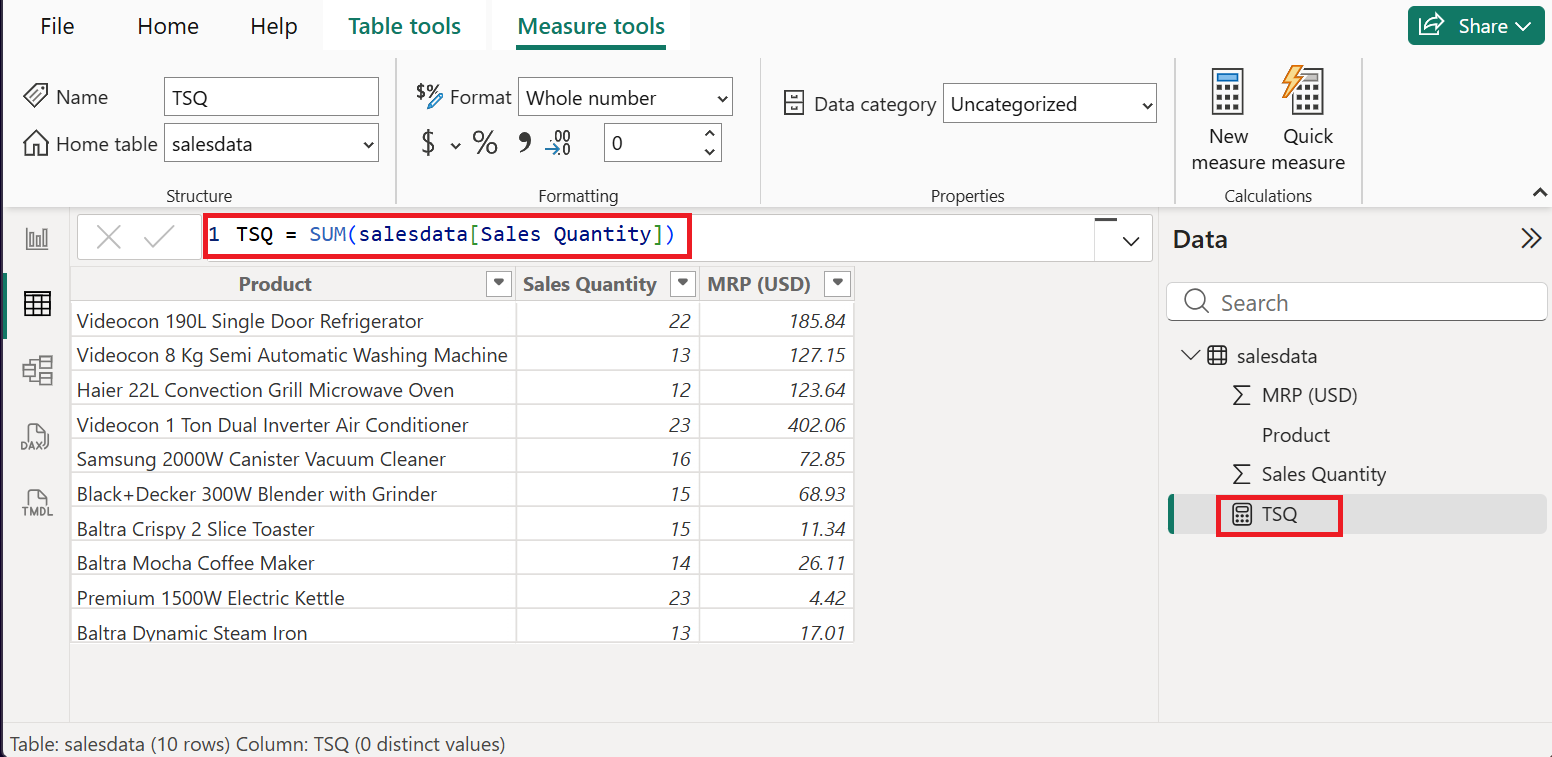
To calculate total quantity sold, we have to calculate the sum of numbers in sales quantity column. In this case, SUM function can be used. Follow these steps to create a measure for total quantity sold.
- Under the Table Tools tab, Click on New Measure.
- In formula bar, use this formula; TSQ = SUM(salesdata[Sales Quantity])
- Press Enter.
This creates TSQ (Total Sales Quantity) measure which can be used in the report section to visualize total sales revenue.
Total Sales Revenue
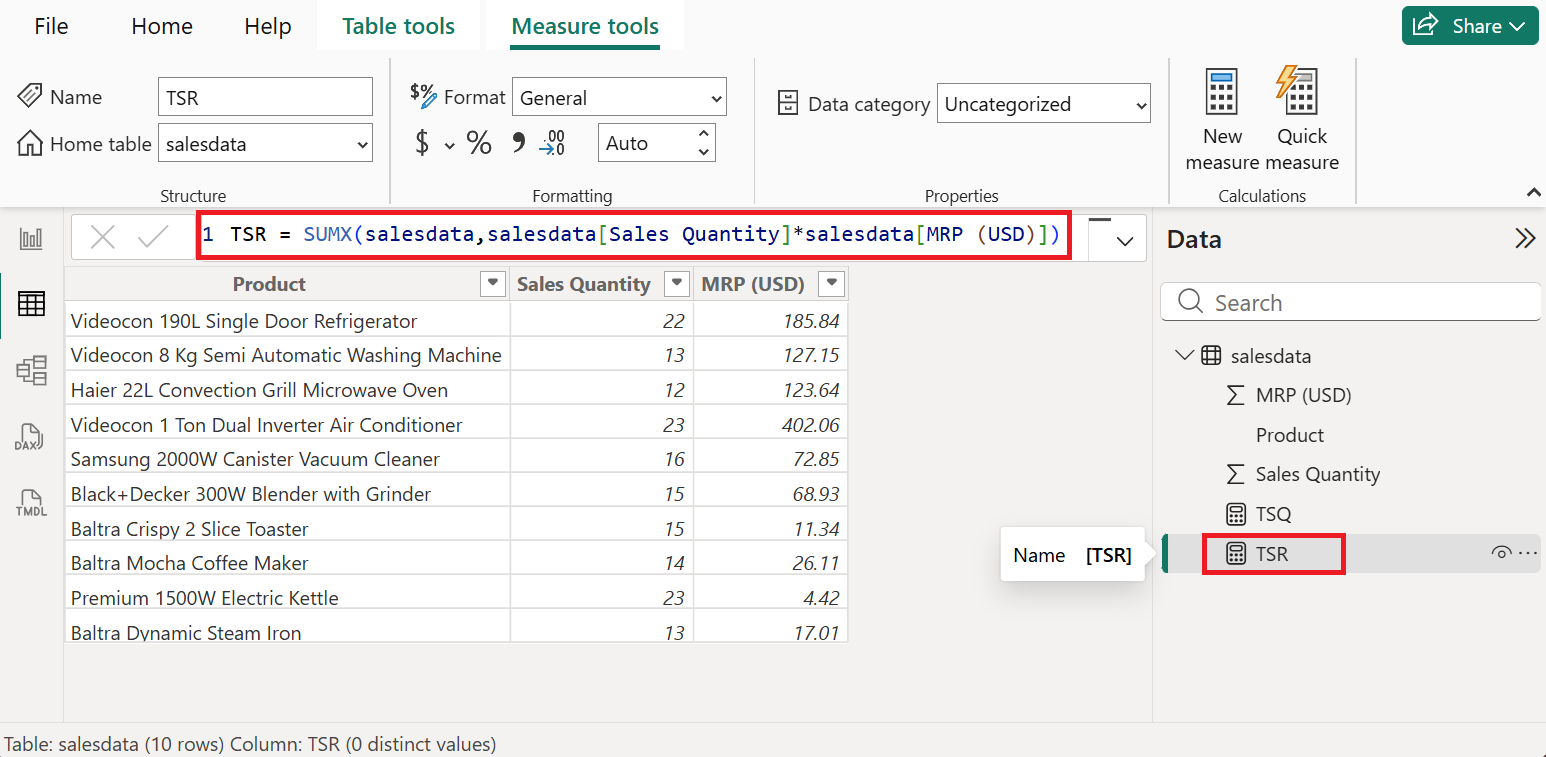
In case of total sales revenue, we have to do row by row calculation. First, multiply each quantity with MRPs then add the result of each multiplication. In this case we can use SUMX function. Follow below given steps to calculate total sales revenue.
- In the Table Tools tab, click on New Measure.
- In the formula bar, insert this formula; TSR = SUMX(salesdata,salesdata[Sales Quantity]*salesdata[MRP (USD)])
- Press Enter.
This creates TSR (Total Sales Revenue) measure. Use this measure to visualize the Total Sales Revenue.
Practice Data File
If you want to practice, you can download the data file (Excel) from the link given below, connect to power BI and practice using the SUM and SUMX function.
Additional Resources to Learn Power BI
Interested in learning more in Power BI, read other articles in power BI or watch video tutorials in YouTube.