SUM vs SUMX in Power BI DAX
Two of the most frequently used DAX functions in Power BI are SUM and SUMX. They look similar but behave very differently. Understanding the distinction is essential for building accurate measures and avoiding common mistakes.
What is SUM?
SUM is an aggregation function. It adds up all numbers in a single column. It works directly on a column and ignores row context. SUM is simple, fast, and perfect when you need a straight total of a column.
SUM ( <column> )
What is SUMX?
SUMX is an iterator. It evaluates an expression for each row in a table and then sums the results. It works row by row and can handle calculations that involve multiple columns. SUMX gives you more flexibility but requires understanding of row context.
SUMX ( <table>, <expression> )
Practical example: Sales table
Imagine a simple sales table with three columns: Product, Quantity, and Unit Price. We’ll use this table to compare SUM and SUMX.
Sales table
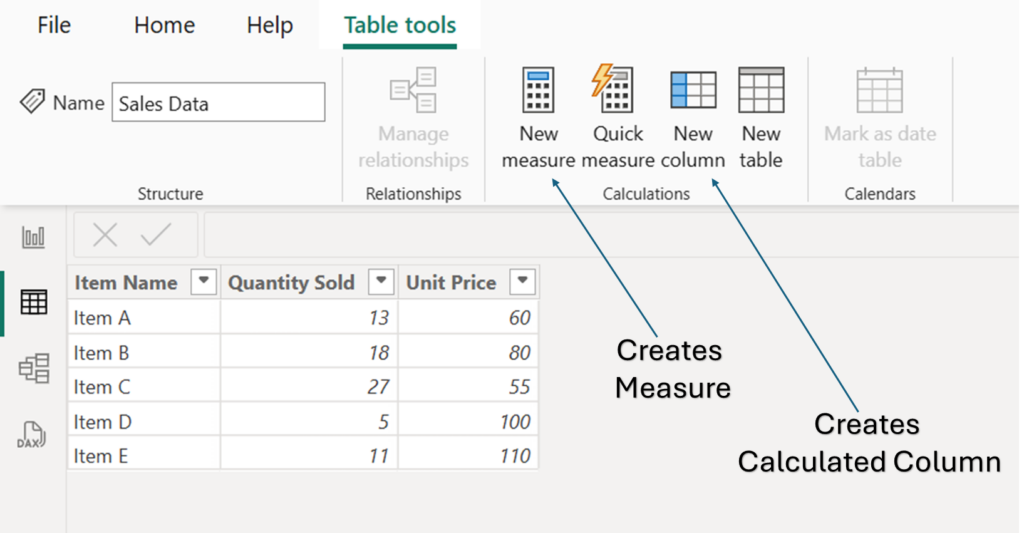
Measure 1: Total Quantity (using SUM)
Result: 2 + 5 + 3 + 1 = 11. Works perfectly because we only need one column.
Measure 2: Total Revenue (using SUMX)
Revenue is Quantity * Unit Price. There’s no revenue column in the table. SUM cannot multiply across columns directly. SUMX solves this.
SUMX goes row by row:
Laptop: 2 * 1200 = 2400
Mouse: 5 * 25 = 125
Keyboard: 3 * 45 = 135
Monitor: 1 * 350 = 350
Then sums these four values: 2400 + 125 + 135 + 350 = 3010.
What if we try SUM for revenue?
Beginners often write: Revenue = SUM(Sales[Quantity] * Sales[Unit Price]) — this will cause an error because SUM expects a single column, not an expression.
Another example: Bonus calculation
Suppose we give a 10% bonus on the total line amount, but only for orders above $500.
SUMX (
Sales,
IF ( Sales[Quantity] * Sales[Unit Price] > 500,
Sales[Quantity] * Sales[Unit Price] * 0.10,
0
)
)
Row by row evaluation:
Laptop (2400 > 500) → 240
Mouse (125 <= 500) → 0
Keyboard (135 <= 500) → 0
Monitor (350 <= 500) → 0
Total bonus = 240. This logic is impossible with plain SUM.
When to use SUM vs SUMX
- Use SUM when you need a straightforward total of an existing column. It’s faster and cleaner.
- Use SUMX when you need to perform row-level calculations, combine columns, apply filters inside the iteration, or use conditions per row.
Performance tip
SUM is usually more efficient because it’s a simple aggregation. SUMX might be slower on very large tables because it iterates over every row. But modern Power BI is highly optimized, so first write correct logic, then optimize if needed. Often the clarity of SUMX is worth the slight overhead.
Common mistake: Unnecessary SUMX
Sometimes people use SUMX when SUM would work fine. Example: SUMX ( Sales, Sales[Quantity] ) is just a complicated way to write SUM ( Sales[Quantity] ). Avoid overcomplicating.
Key takeaway
SUM and SUMX are both essential. SUM is your go-to for simple column totals. SUMX is your tool for custom row-by-row logic. Master both and you’ll be able to handle 90% of common aggregation tasks in Power BI.
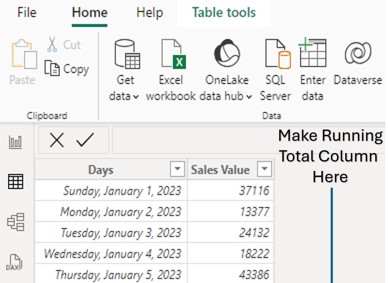
Now go ahead and test these in your own Power BI model. Create a small table, write both measures, and see the difference firsthand.