In this article, you will learn all the Excel basics a beginner in learning Excel should understand.
Introduction
Microsoft Excel is a powerful spreadsheet software developed by Microsoft Corporation. It is a part of the Microsoft Office suite of productivity tools and is widely used for various tasks involving data organization, analysis, and visualization. Microsoft Excel is one of the mostly used spreadsheet by various organizations and individuals throughout the world. It has a great use for your job and business.
Opening Excel in Computer
To open Excel in Computer, first of all, it should be installed. Most of the newly brought computers comes with the Microsoft Excel (along with other office apps) installed. IF not, you have to install it by going to Microsoft’s website. Once Installed, go to start menu and in the list of programs, you will find Microsoft Excel.
User Interface of Excel
Let’s have a look at the user interface of Excel. The important area and their name is in below image illustration.

If you have the latest excel version, you will get a welcome screen as given below. Where you have the options for opening pre build templates, recent workbooks, shared workbooks etc. Click on Blank Workbook option to go to the main user interface of Excel (above image).

Structure of Row, Column and Cell
Row, Column and Cell are the basic components of every spreadsheet program and the same is also in MS Excel. Every horizontal line denoted by numbers (1,2,3,4…) are the Rows and every vertical line denoted by alphabets (A,B,C,D…) are the columns. At the intersection point of every row and column, there is a rectangle shaped box formed which is called Cell. Cell is the container of data. We can enter different type of values in the cells.
Below image gives more information about the structure of Excel.

As you see in the image, at the intersection of column D and row 7, a cell is formed. The cell is called active because it is in selection mode. You can see the selected cell address in the name box (red highlighted).
After learning the row, column and cell, you may have a question in mind. How many rows, columns and cells Excel has? Let’s look into below image for the answer of this.

Entering Data and Basic Formatting
Now let’s look into how we enter data and do formatting in excel. Formatting means changing the visual appearance of the data.

As a beginner in Excel learning, you have to understand few things for entering the data. They are;
- Once you write something in the cell, pressing ENTER key will keep that value in the cell and go to one cell down. (This you can also do by pressing RIGHT, LEFT, UP, DOWN arrow keys in the keyboard)
- If you want to edit the value in the cell, double click in the cell to go to edit mode. Alternatively, you can click on the cell and go to formula bar to edit the value.
- By using the tools available in different tabs, we can change the formatting of our data.
Using Basic Formulas in Excel
Formulas and function are the beauty of Microsoft Excel. There are more than 400 function available in Excel. Functions are the name like SUM, COUNT, MAX, VLOOKUP, SUMIF etc. Formulas are the expression we make to do the actual calculation. For Example, =SUM(B4:B8) is the formula.
In the same data entry above, let’s do some calculations by using excel functions.

By using various functions, we do data calculation, analysis in Excel. The functions used above are basic functions just for the beginners. There are so much more we have to learn about the formulas and function in Excel which we will learn in upcoming tutorials.
Data Visualization in Excel
Let’s learn the basics of data visualization in Excel. Visualization is presenting the data in chart and diagrams so that it will be easier for everyone to understand the pattern of data. It helps on getting the deep understanding of the data.
The basic process of visualizing data in Excel is in below image illustration.

Note: To select Item Name range and Average Sales, first select the item name range, then press and hold Ctrl key in keyboard, then select the Average Sales range.
This is all about the basic overview of using Microsoft Excel. There are so much more we have to learn. We will deep dive into learning Excel in the upcoming tutorials.


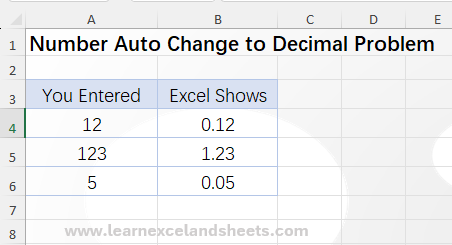


Pingback: Number Auto Change to Decimal in Excel: Learn How to Solve - Learn Excel and Sheets