In today’s data-driven world, businesses and individuals need tools to turn raw data into meaningful insights. Microsoft Power BI is one such powerful tool that simplifies data visualization, reporting, and analysis. This beginner-friendly Power BI tutorial will guide you through the basics which helps you on getting started.

What is Power BI?
Power BI is a business analytics platform developed by Microsoft. It allows users to connect to various data sources, transform raw data into interactive dashboards, and create visually appealing reports. With its user-friendly interface and robust features, Power BI empowers beginners and professionals alike to uncover trends, make data-driven decisions, and share insights effectively.
Power BI is part of the Microsoft Power Platform and integrates seamlessly with other Microsoft tools like Excel, Azure, and SQL Server, as well as third-party services such as Google Analytics and Salesforce.
Key Features of Power BI:
- Data Connectivity: Connect to hundreds of data sources, from Excel files to cloud-based databases.
- Interactive Dashboards: Build dynamic visualizations that update in real-time.
- Drag-and-Drop Interface: No coding skills required—perfect for beginners.
- AI Capabilities: Leverage built-in AI to gain deeper insights.
- Sharing and Collaboration: Share reports with your team or publish them online.
Power BI comes in three main versions:
- Power BI Desktop: A free Windows application for creating reports and dashboards.
- Power BI Service: A cloud-based platform for sharing and collaborating on reports.
- Power BI Mobile: Apps for iOS and Android to view reports on the go.
For beginners, Power BI Desktop is the best place to start.
How Does Power BI Work?
Power BI follows a straightforward workflow that transforms raw data into actionable insights. Here’s a breakdown of how it works:
- Connect to Data: Import data from various sources like Excel, CSV files, databases, PDF or online services.
- Transform Data: Clean and shape the data using Power Query, a built-in tool for removing duplicates, fixing errors, or combining datasets.
- Model Data: Define relationships between datasets (e.g., linking sales data to customer data), create measures to enable deeper analysis.
- Visualize Data: Use charts, graphs, maps, and tables to create interactive reports and dashboards.
- Share Insights: Publish your work to the Power BI Service or export it as a PDF/PowerPoint for presentations.
Power BI’s strength lies in its ability to handle large datasets and present them in an easy-to-understand format, even for those new to data analysis.
How to Install Power BI Desktop
Getting started with Power BI is simple. Follow these steps to install Power BI Desktop on your Windows computer:
Installation Steps:
- Visit the Official Website: Go to the Power BI Desktop download page or you can also download it from Microsoft Store.
- Download Power BI Desktop: Click the “Download” button. You’ll be redirected to the Microsoft Store, or you can download the installer directly.
- Run the Installer: Once downloaded, open the .msi file and follow the on-screen prompts.
- Accept the license agreement.
- Choose the installation location (default is fine for beginners).
- Click “Install.”
- Launch Power BI Desktop: After installation, open the app from your Start menu. You’ll be greeted with a welcome screen.
- Sign In (Optional): Sign in with a Microsoft account to access additional features like publishing to the Power BI Service. You can skip this for now and explore offline.
Getting Started with Power BI: A Beginner’s Walkthrough
Now that you’ve installed Power BI Desktop, let’s dive into the basics of using it.
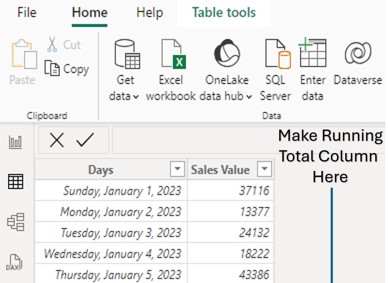
Step 1: Import Data
- Open Power BI Desktop.
- Click Get Data from the Home tab.
- Choose a data source (e.g., Excel, CSV, or a sample dataset). For practice, download Microsoft’s “Financial Sample” dataset from their website or use your own Excel file.
- Select your file and click Load to import it or Transform Data to clean it first.
Step 2: Transform Data with Power Query
Power Query is Power BI’s data transformation tool. It’s beginner-friendly and doesn’t require coding.
- Remove unnecessary columns: Right-click a column header and select “Remove.”
- Filter rows: Use the dropdown arrow in a column to filter out unwanted data.
- Fix data types: Ensure dates, numbers, and text are correctly formatted by clicking the data type icon next to the column name.
- Click Close & Apply to save changes and return to Power BI Desktop.
Step 3: Create Visualizations
- On the right-hand side, you’ll see the Fields pane listing your data columns.
- Drag fields (e.g., “Sales” or “Date”) into the canvas to start building visuals.
- From the Visualizations pane, select a chart type (bar, line, pie, etc.).
- Customize your visual: Adjust colors, labels, or filters using the Format options.
Step 4: Build a Dashboard
- Add multiple visuals to the same page to create a dashboard.
- Use slicers (interactive filters) to let users explore data dynamically. Add a slicer by selecting it from the Visualizations pane and linking it to a field like “Region” or “Date.”
Step 5: Save and Share
- Save your project as a .pbix file by clicking File > Save As.
- To share, publish to the Power BI Service (requires a free or Pro account) or export as a PDF (does not require account).
Key Concepts Beginners Should Know
Here are some important concepts to understand as you learn Power BI:
1. Data Sources
Power BI supports a wide range of data sources:
- Files: Excel, CSV, JSON.
- Databases: SQL Server, MySQL, Oracle.
- Online Services: Google Sheets, SharePoint, Dynamics 365.
- Start with simple Excel files to get comfortable before exploring complex sources.
2. Power Query
This is your go-to tool for cleaning data. Learn basic transformations like removing blanks, splitting columns, or merging tables.
3. DAX (Data Analysis Expressions)
DAX is Power BI’s formula language for creating calculated columns and measures. Beginners can start with simple formulas like:
- Total Sales = SUM(Sales[Amount])
4. Relationships
When working with multiple tables, define relationships (e.g., linking “Orders” and “Customers” by a common ID) to analyze data across datasets.
5. Visuals and Filters
Experiment with different chart types and use filters to focus on specific data subsets (e.g., sales by region).
Tips for Beginners
- Start Small: Use a simple dataset to practice importing, transforming, and visualizing.
- Explore Sample Reports: Power BI Desktop includes sample datasets (e.g., “Retail Analysis”) to help you learn.
- Watch Tutorials: Free resources on YouTube could be a great help. Click here to watch YouTube Videos.
- Join the Community: The Power BI Community (community.powerbi.com) is a great place to ask questions and find templates.
- Practice Regularly: Build small projects like a personal budget tracker or sales dashboard to reinforce your skills.
Common Beginner Mistakes to Avoid
- Skipping Data Cleaning: Dirty data leads to inaccurate reports. Always use Power Query to preprocess your data.
- Overloading Dashboards: Too many visuals can confuse viewers—keep it simple and focused.
- Ignoring Updates: Power BI Desktop gets updates with new features. Keep it updated for the best experience.
Next Steps
Once you’re comfortable with the basics, explore these advanced features:
- Power BI Service: Collaborate and share reports online.
- Custom Visuals: Download additional chart types from the Power BI marketplace.
- DAX Deep Dive: Learn more complex formulas for advanced analysis.
Power BI is a skill that grows with practice. Start with small projects, experiment with your data, and soon you’ll be creating professional-grade reports.
Ready to dive in? Download Power BI Desktop today and transform your data into insights. Happy analyzing!