Sales tracking is critical for businesses to assess their performance and growth. One way to measure sales effectiveness is by calculating the variance between sales targets and actual achievements, as well as the percentage growth compared to the previous year. In this guide, we’ll walk you through how to easily calculate these figures using Microsoft Excel.
Table of Contents:
- Setting Up the Data
- Calculating Sales Target vs. Achievement
- Calculating Growth Over Last Year (%)
- Displaying Result Along With % Symbol
- Practice Workbook Download
- Video Tutorial
1. Setting Up the Data
Before any calculations, it’s important to have a well-organized dataset. Let’s assume you have the following data.
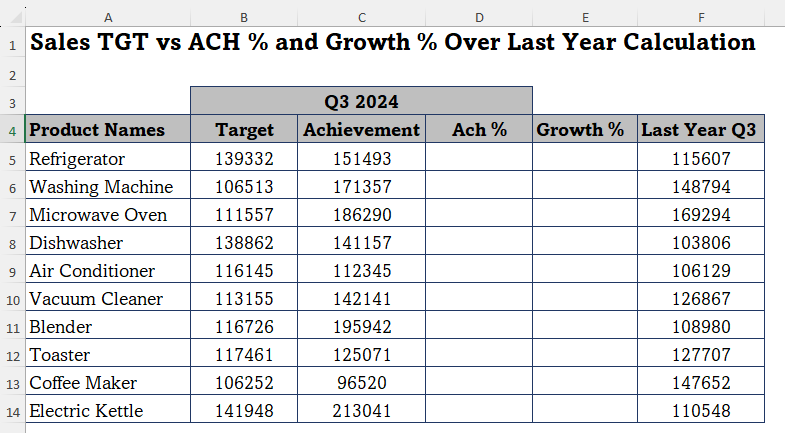
You’ll use the columns Target, Achievement, and Last Year Q3 to calculate the following metrics:
- Sales Ach. Percentage
- Growth Over Last Year %
2. Calculating Sales Target vs. Achievement %
The first metric we will calculate is the achievement percentage, which shows how close your actual sales are to your target. The formula for calculating achievement is:
Ach % = Sales Ach / Sales Target *100Steps:
- Add a new column called Achievement %.
- In the first cell under this column (e.g., D5), enter the following formula:
= (C5 / B5) * 100Where:
C5is the Actual Sales for the month.B5 is the Sales Target for the month.
Drag the formula down to fill in the rest of the cells in the column.
This will give you the percentage of the target that was achieved for each month.
3. Calculating Growth Over Last Year (%)
The second metric is Growth Over Last Year, which shows the percentage increase (or decrease) in sales compared to the same period from the previous year.
The formula for calculating the growth percentage is:
Growth (%) = This Year Sales/Last Year Same Period Sales*100-100Steps:
- Add a new column called Growth Over Last Year (%).
- In the first cell under this column (e.g., E5), enter the following formula:
= C5/F5*100-100Where:
C5 is the Actual Sales for this year.- F5 is the Sales for last year.
- Drag the formula down for the rest of the rows.
This will give you the percentage growth (positive or negative) compared to the previous year for each month.
4. Displaying the Result Along with % Symbol
If you want to display the % symbol along with the result, the formula will be little different. Use below given formula for the calculations and apply % formatting in the result cell by clicking on the % tool in the Home tab.
Achievement % = Sales Achievement / Sales Target
Growth % = This Year Sales / Last Year Same Period Sales - 1

Alternatively, you can also use;
Growth % = ((This Year Sales - Last year Sales) / Last Year Sales)
5. Practice Workbook Download
Download the practice workbook file from the download button below.
6. Video Tutorial
Watch the video tutorial for step-by-step instructions from below.
Conclusion
Tracking sales target vs. achievement and growth over last year are key metrics for assessing performance. Microsoft Excel makes it easy to calculate these figures using simple formulas. By organizing your data properly and applying the formulas discussed above, you can create a dynamic sales tracking system to visualize and analyze performance over time.
Whether you’re managing a small business or analyzing large-scale sales data, Excel provides the flexibility and power you need to monitor and achieve your business goals.