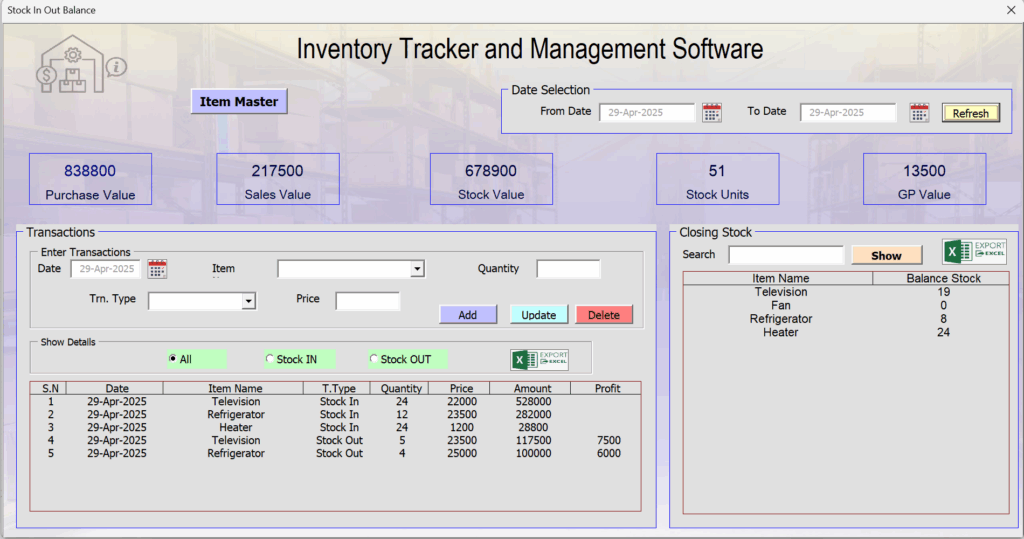
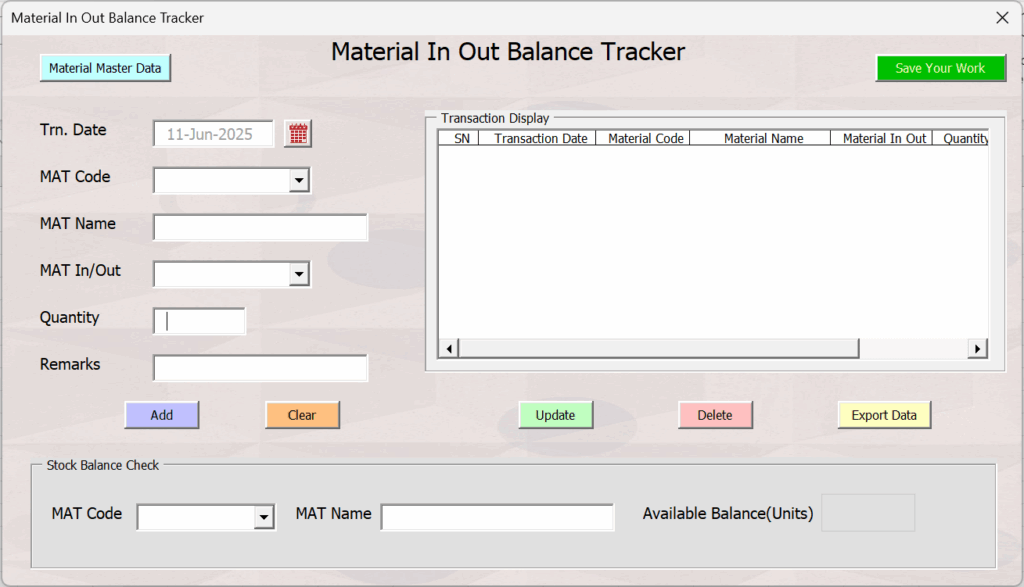
In this tutorial you will learn how to create and use the stock in out balance tracker template in Microsoft Excel.
Below is the preview of the template.
Scope
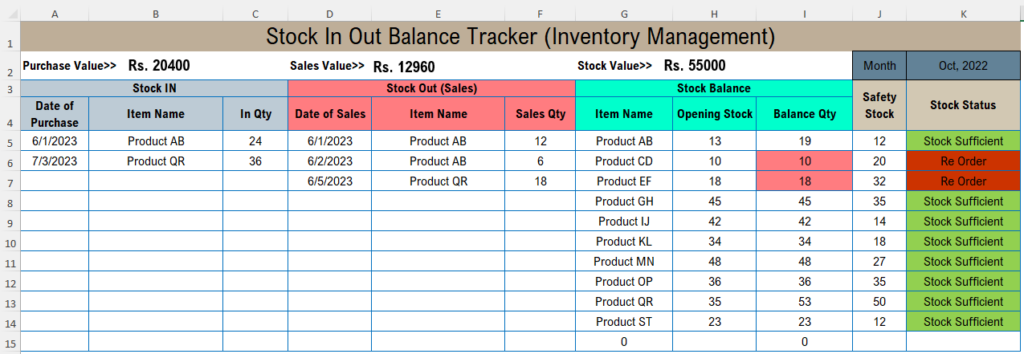
If you are a trading company who purchase the product and resell it to various customers, this template is useful for you. This template can be slightly modified and use for manufacturing companies too. You can keep track of movement of inventory or stock in effective manner. You can see whether re-order of product is required or not. By using the template, the tracking and management of inventory becomes easy and effective.
Features
Below are the key features of this template.
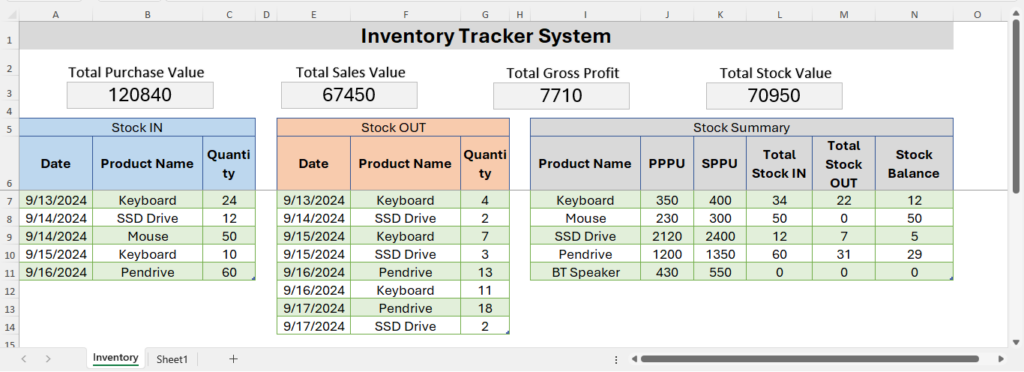
- Tracking of stock IN (Purchase), OUT (Sales) and Balance (Stock in Hand) effectively.
- Automatically calculates the safety stock requirement by using a most commonly used calculation method.
- Automatically suggests or notifies for the reorder requirement of every single items.
- Automatically gives information on transit goods.
- Automatic calculation of Inventory value in different levels.
- Easy to generate purchase and sales reports.
Basic Guideline on How to Prepare this Template
Follow these guidelines to prepare this template from scratch.
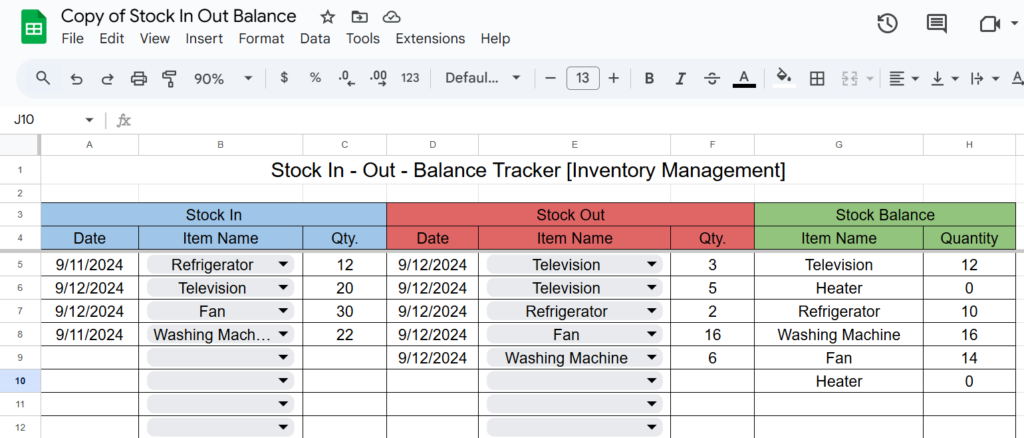
- Create two sheets in Excel, one “Dashboard” and another “Tracker.”
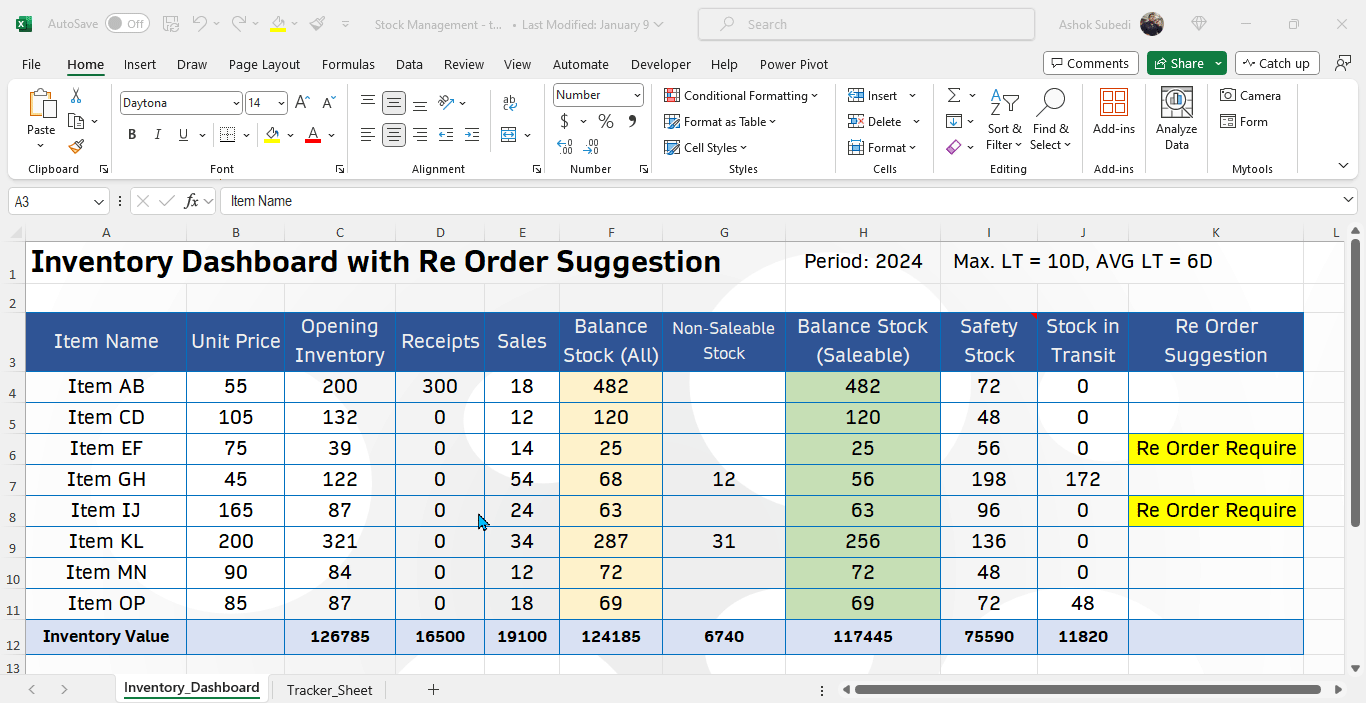
- In the Dashboard sheet, put these column headers; Item Name, Unit Price, Opening Inventory, Receipts, Sales, Balance Stock(All), Non-Saleable Stock, Balance Stock (Saleable), Safety Stock, Transit Stock and Re-Order Suggestion.
- In the Tracker sheet, make 3 sections; “Stock Out”, “Stock In” and “Stock Ordered”. In each section, create column for date, item name and quantity. Add one more column for stock ordered section, that is the “status of received or transit”.
- After creating the structure of template, use formulas to make it dynamic. To learn the formula in detail, download the template or watch video tutorial from the end of this tutorial.
Values and Formula for Each Column
Dashboard Sheet

Item Name: Update all the items or SKU you have. You can type or copy paste from other spreadsheet file.
Unit Price: Update price per unit of each item.
Opening Inventory: Update the stock in hand at the beginning of period. If you are making this template for year 2024, the stock quantity you have in warehouse at 1st of Jan 2024 should be populated.
Receipts: Receipt data is available in the Tracker sheet. Get the item wise total received quantity by using SUMIF Function.
Sales(Stock Out): Sales data is available in the Tracker sheet. Get the item wise total sales quantity by using SUMIF Function.
Balance(All): Calculate this by OPENING + IN – OUT.
Non-Saleable Stock: Fill this manually. Non saleable stock is the damage and expired stock that can’t sale.
Balance Stock (Saleable): Calculate this by Balance(All) – Non Saleable Stock.
Safety Stock: Safety Stock is the stock required for the lead time. Lead time is the time gap between order data and physical product receipt date. Calculate this by using this formula.
Safety stock = (Max. Daily Req. X Max. Lead Time) – (Avg. Daily Req. X Avg. Lead Time)
Note: To calculate Maximum and Average daily requirement, first of all we have to merge the per day sales of each item by creating helper columns. Because, in stock out section, there might be more than one transaction of each item in a single day. Hence, it should be merged. Refer O to R column of tracker sheet for more clarity.
Stock in Transit: Transit Qty is available in the tracker sheet. Get this by using the SUMIFS function.
Re-Order Suggestion: Use IF function to dynamically display the re-order suggestion. IF the saleable stock is less than the safety stock plus transit stock, you need to place the re-order request to your supplier.
Tracker Sheet
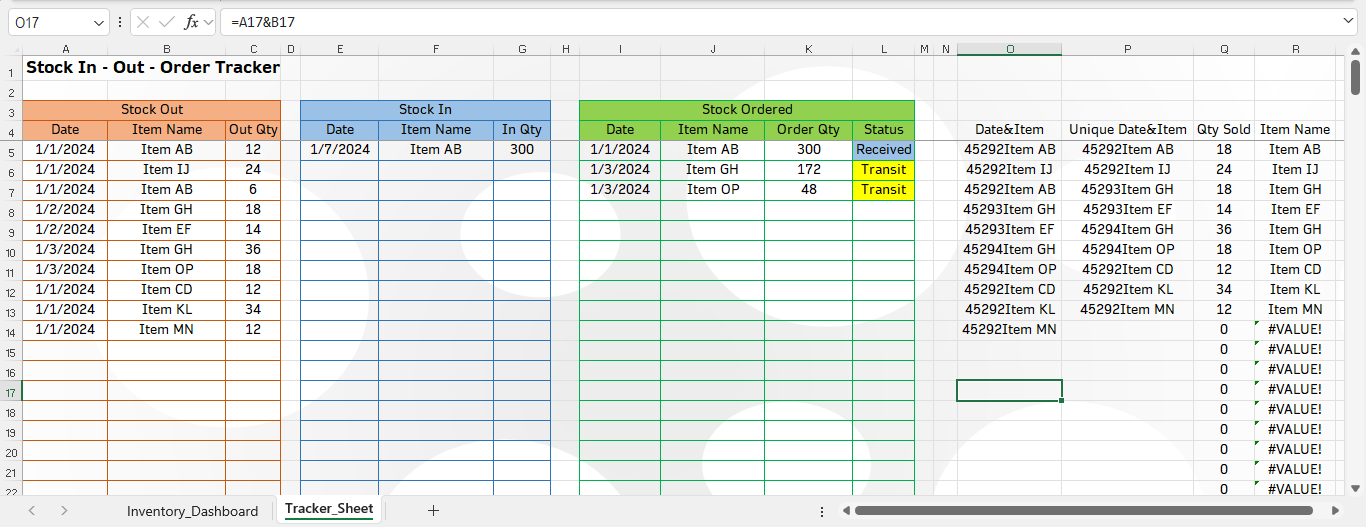
Stock Out and Stock In Section: Populate the data manually. Every time new transaction occurs, immediately update this. You can copy paste the data from other source too. But make sure the item names are exactly same with the dashboard sheet. For item name, you can make a drop-down list by linking it with dashboard sheet item name range. This makes data entry easy.
Stock Ordered Section: Populate data manually in all fields. You can create a dropdown for “item name” and “status” column to ensure error free entry.
Helper Columns (O to R): First, join date and item to make unique combination of date and item. Then make a unique list of that combination by using the UNIQUE function. In next column, calculate the total quantity sold for the unique combination of date and item by using the SUMIF function. In next column, extract the item name only from the unique combination of date and item by using the RIGHT function. This will be used to calculate the maximum daily requirement and average daily requirement.
Template Download
Download, practice and use the Stock In-Out-Balance template with auto re order suggestion from below.