In this tutorial, you will learn how to make Gantt Chart in Google Sheets. Gantt Chart is a type of bar diagram to visually illustrate the details of project such as tasks, start date, days required, end date etc.
Creating Gantt Chart basically involves these steps.
- Prepare the project details ready (Task Name, Start Date, End Date and Days Required)
- Make the Gantt Chart
Prepare the Project Details
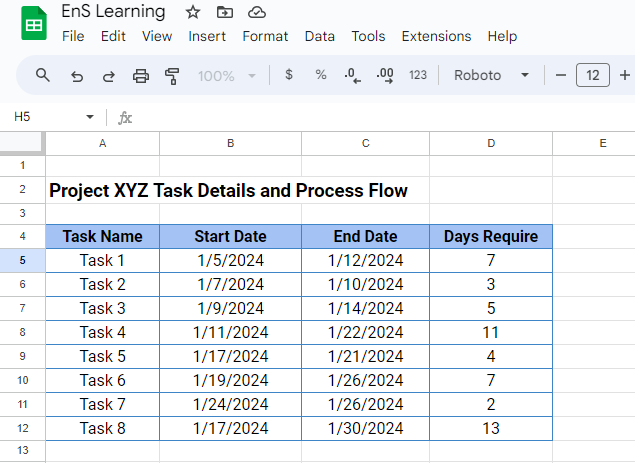
First, make the project details ready. This includes name of the task, start date, end date and days required. Calculate required days by simply subtracting the start date from end date.
Below is the sample of project details based on which we will make Gantt Chart.
Make the Gantt Chart
Follow these steps to make the Gantt Chart.
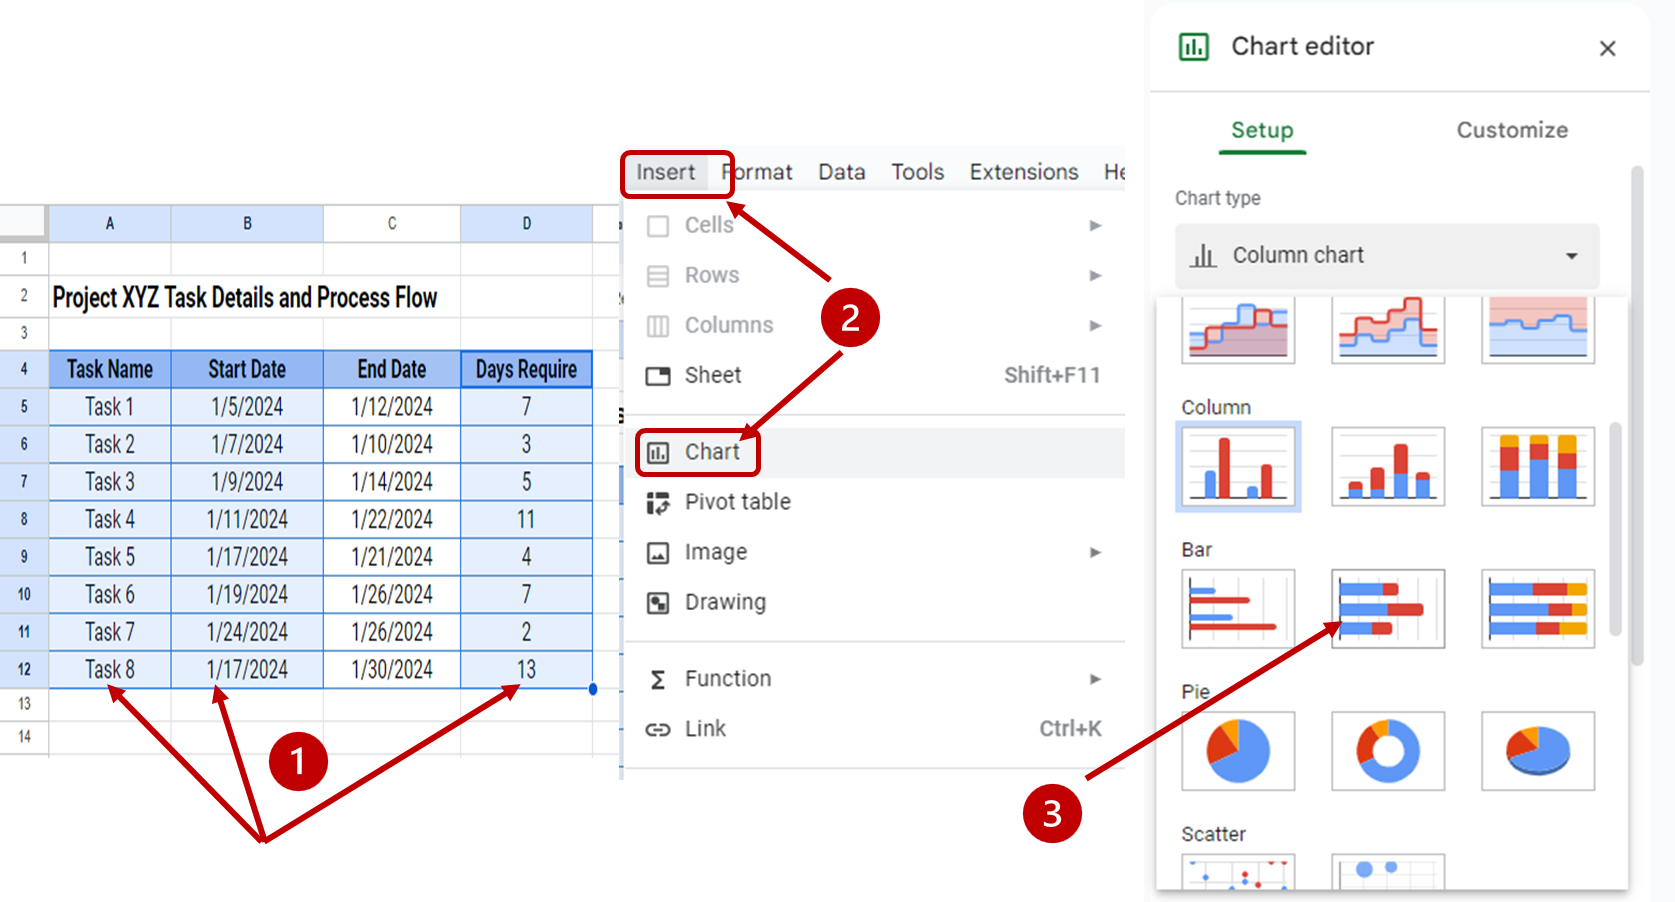
Step 1. Select Task Name, Start Date and Days Require columns. For this press and hold the “Ctrl” key in keyboard, then select these columns one by one.
Step 2. Click on “Insert” tab, then “Chart”. By default a column chart gets created.
Step 3. Change the chart type to “Stacked Bar Chart”
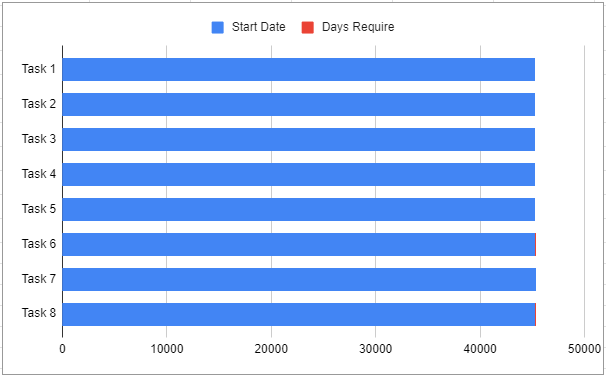
This creates a chart as below.
Step 4. The Dates are given in number format and are the very first dates these are set in Google Sheets. Change them to recent date by double clicking the X axis (horizontal axis) date values. In the Minimum and Maximum date, keep the number format of the project start date and end date. While setting minimum date, take few days prior to the actual starting date of project.
Note: To identify numeric value for start data and end date follow instruction given in below animated image.
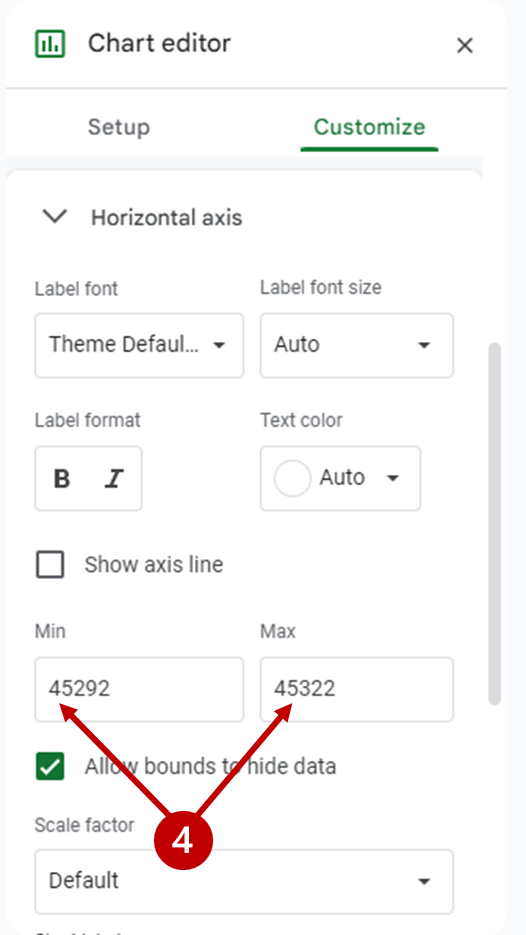
Step 5: After setting minimum and maximum values, scroll down and change the number format to date format.
Now the chart looks like this.
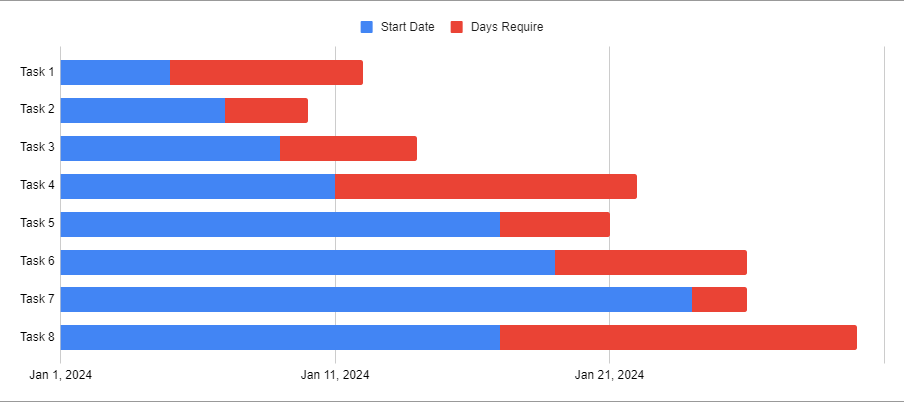
The blue portion of bar is showing the start date and the red is showing the days require.
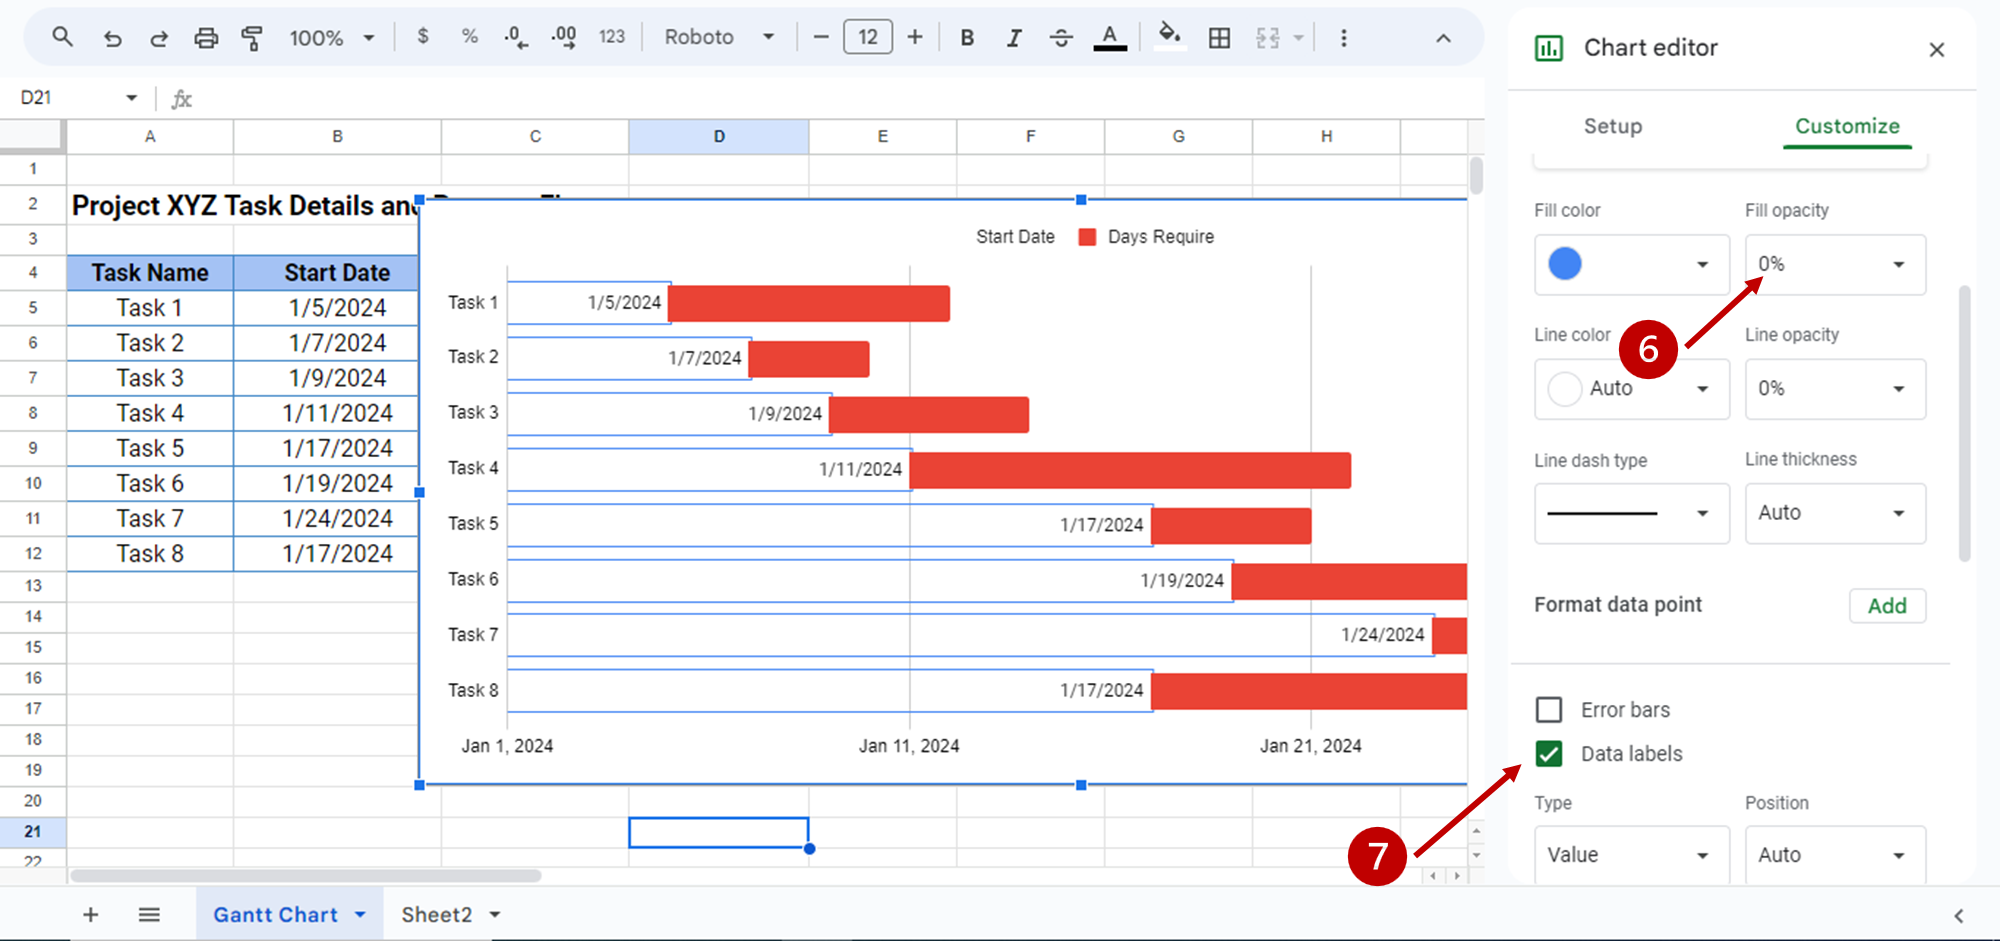
Step 6. Double click on the blue bar to select all bars, this will open chart editor. Click on the “customize” tab and in “fill opacity” option, make 0%.
Step 7. To show the start date of every single task, check the “data label” checkbox.
Step 8. Show the days required values inside the bar by clicking on days series and mark “data labels” checkbox.

Now the Gantt Chart is ready. You can do more customization to your chart by adding chart title, adding background fill color etc. by using the “chart editor” pane.