Microsoft Power BI is a powerful business intelligence tool that allows users to transform raw data into insightful visualizations. Two fundamental concepts in Power BI for performing calculations are calculated columns and measures. While they might seem similar at first glance, they serve distinct purposes and are used in different scenarios. In this article, we’ll explore the differences between calculated columns and measures, their use cases, and provide practical examples to clarify their use.

What is a Calculated Column?
A calculated column is a column you add to an existing table in Power BI using a DAX (Data Analysis Expressions) formula. The value for each row in the column is calculated at the time of data refresh and stored in the data model. Calculated columns are static in the sense that they don’t change dynamically based on slicers, filters, or user interactions in a report. They are precomputed and fixed until the data is refreshed.
Key Features:
- Computed row-by-row during data refresh.
- Stored in the data model, consumes memory.
- Ideal for calculations that need to be reused across multiple visuals or as part of other calculations.
- Behaves like any other column in the table (e.g., can be used in filters, slicers, or rows/columns in visuals).
What is a Measure?
A measure is a dynamic calculation defined using DAX that is evaluated based on the context of the report (e.g., filters, slicers, or aggregations). Unlike calculated columns, measures are not stored in the data model—they are calculated when a visual requests the result. Measures are typically used for aggregations like sums, averages, or counts.
Key Features:
- Computed dynamically at query time, not stored in memory.
- Context-sensitive, meaning their results change based on filters or slicers applied in the report.
- Ideal for summarizing data (e.g., total sales, average profit).
- Cannot be used directly as a column in a table visual.
Key Differences Between Calculated Columns and Measures
| Aspect | Calculated Column | Measure |
|---|---|---|
| Definition | A static column added to a table. | A dynamic calculation created for visualization. |
| Storage | Stored in the data model (takes up memory). | Not stored; calculated at runtime. |
| Evaluation | Computed during data refresh. | Computed when a visual or filter is applied. |
| Use Case | Row-level calculations (e.g., profit per row). | Aggregations (e.g., total sales, averages). |
| Context | Row context only. | Filter context and row context (if applicable). |
| Performance | Impacts memory usage. | Impacts query performance. |
Example 1: Calculated Column
Scenario: You have a sales table with columns Quantity and Unit Price, and you want to calculate the total sales amount for each row in a new column.
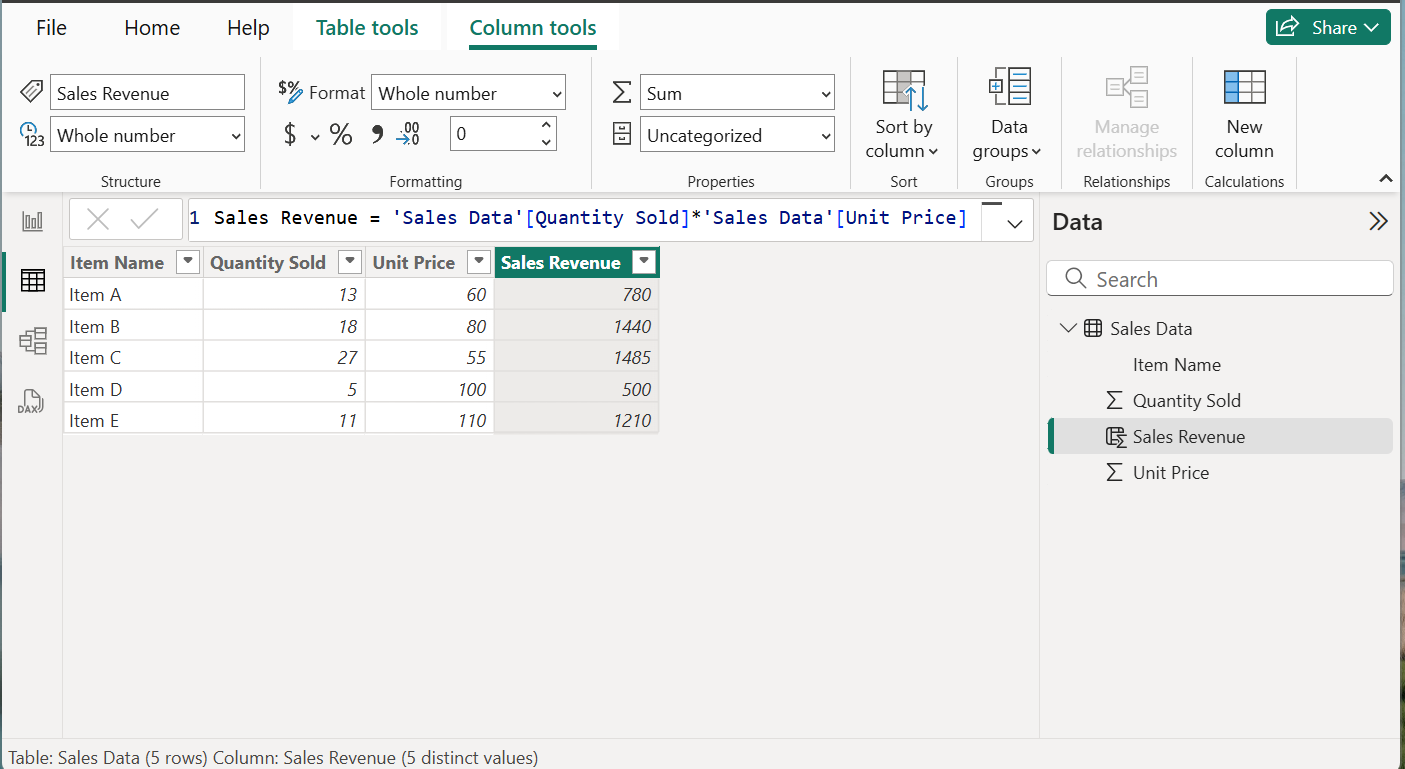
DAX Formula:
Sales Revenue = 'Sales Data'[Quantity Sold]*'Sales Data'[Unit Price]How it Works:
- This creates a new column called Sales Revenue in the
SalesData table. - For each row, Power BI multiplies
UnitPricebyQuantityand stores the result. - Once calculated, the
Sales Revenuecolumn can be used in visuals (e.g., as a slicer or in a table) or as part of other calculations.
Use Case: Use a calculated column when you need a fixed, row-level computation that won’t change with report filters.
Example 2: Measure
Scenario: You want to calculate the total sales revenue across all rows, dynamically adjusting based on filters (e.g., Item Name)
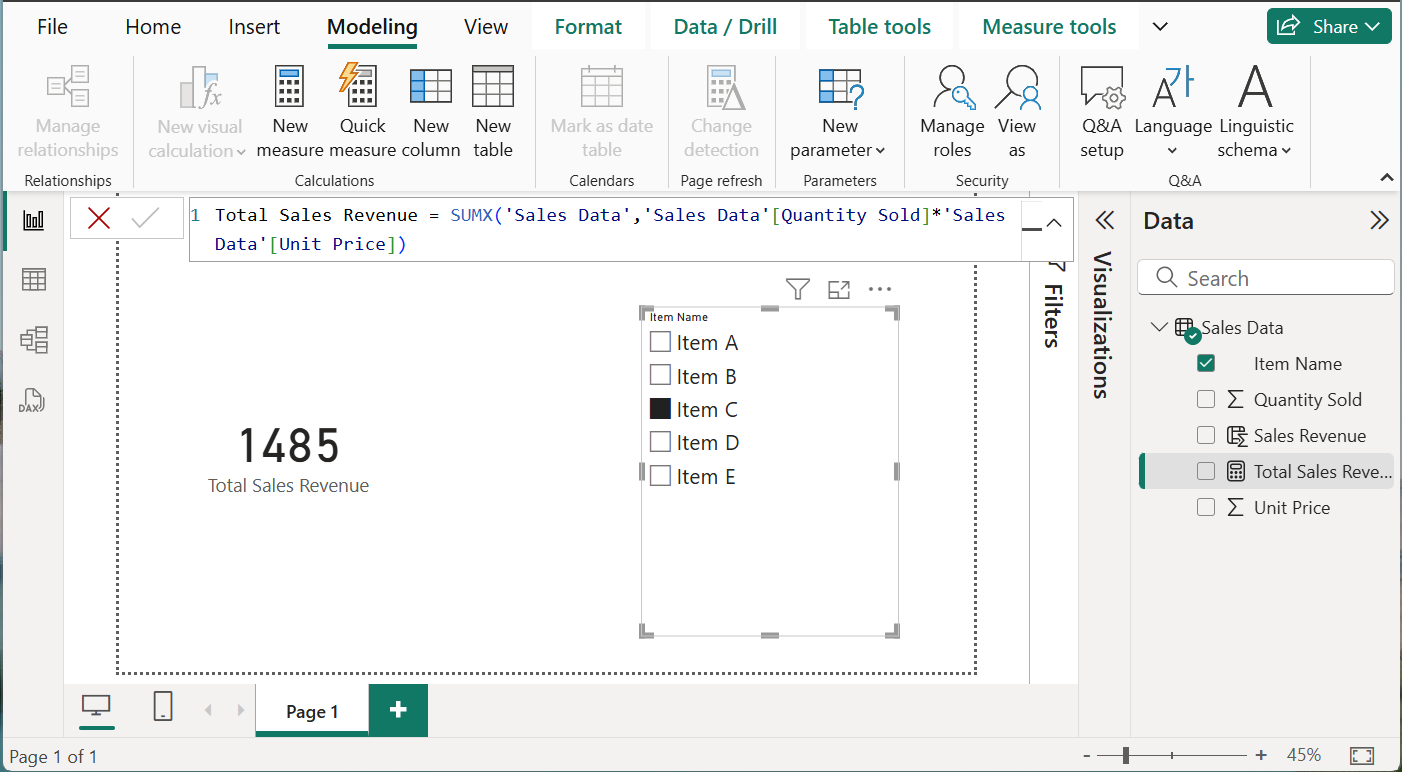
In above image, see in the data pane, Total Sales Revenue measure is created which is used in the visual. Using the item filter, item C is selected which is displaying the total sales revenue for item C only.
DAX Formula:
Total Sales Revenue = SUMX('Sales Data','Sales Data'[Quantity Sold]*'Sales Data'[Unit Price])Alternative (simpler version):
Total Sales Revenue = SUM('Sales Data'[Sales Revenue])(Assuming the Sales Revenue calculated column already exists.)
How it Works:
- This measure calculates the sum of sales dynamically based on the current filter context.
- If a user filters the data to a specific item, the measure recalculates accordingly.
- It’s not stored as a column but displayed in visuals like cards, charts, or tables.
When to Use Calculated Columns vs. Measures
Use Calculated Columns When:
You need a value computed for every row (e.g., profit per transaction).
The result will be used in slicers, filters, or as a base for other calculations.
The calculation doesn’t depend on report filters.
Use Measures When:
You need aggregations (e.g., total revenue, average cost).
The calculation should adapt to slicers, filters, or other report interactions.
You want to optimize memory usage by avoiding unnecessary stored data.
Conclusion
In Power BI, calculated columns and measures are essential tools for data analysis, but they cater to different needs. Calculated columns are best for static, row-level calculations stored in the model, while measures shine in dynamic, context-aware aggregations. Understanding when to use each can significantly improve your report’s performance and clarity. By leveraging both effectively, you can unlock the full potential of Power BI to deliver actionable insights.